1
Introduction
The project also implements a sniffer that will help measuring the cost efficiency of the distribution. As a sniffer the project will use component Network Weather Service (NWS) that is loaded freely from the Internet. With NWS the bandwidth and the latency between two machines will be measured and the line diagram will be made to visualize the results.
This sniffer plan describes the implementation
of the sniffer. In
Chapter 2 the structure of the sniffer is described and in Chapter 3 the user
interface of the sniffer is presented.
2
The
structure of the sniffer
The project
will use the NWS component to implement the sniffer and with NWS the bandwidth
and latency in the network will be measured. NWS contains three components that
are needed in the project: a name server, a memory host and a sensor host. A name
server is an NWS host that provides all other hosts with information about
the location and abilities of other NWS hosts. A memory host’s task is
to store and retrieve measurements for other hosts and a sensor host can
be set up to monitor resource availability.
3
The
user interface of the sniffer
The user
interface of the sniffer is very simple and is seen in Figure 1. First the user
has to choose which of the calculated fractals he wants to consider. After
this, the user can determine two machines, source and destination machine, that
have participated in calculating the defined fractal. When the View results
button is pressed the bandwidth and latency values are shown between these two
machines in a line diagram. The values are shown from the beginning of the
calculation till the end of it.
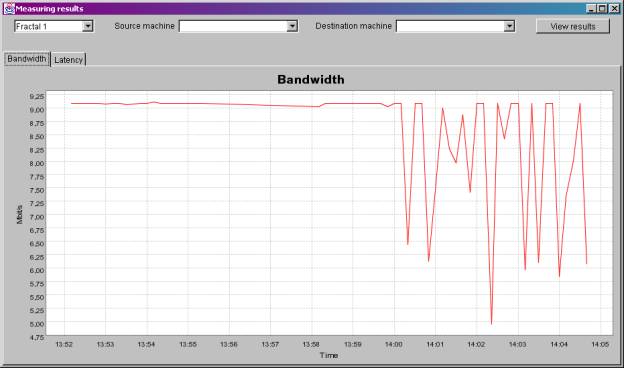
Figure 1. The sniffer window
The total time of the fractal calculation is also an important part of getting results of the cost efficiency of the distribution. This information will be presented in the actual user interface in connection with each of the drawn fractal. The time measuring will be started when the calculation task is sent to the calculating machines with Globus and stopped after the calculation is finished.